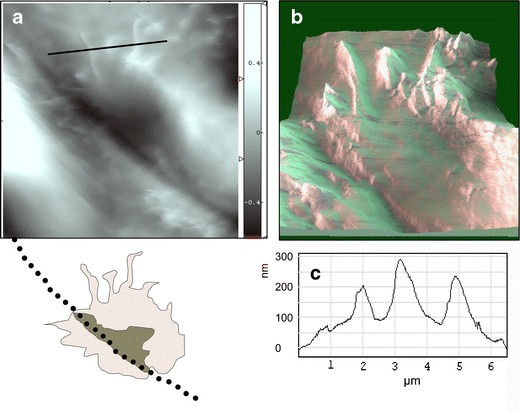
Fig. 7.

Filopodial protrusions around a CLDS. Samples were prepared as for Fig. 5a. AFM contact image of the CLDS in the endothelial cell; in the sketch below, the interface area is shaded brightly, the actual cup darkly, and the cell junction is denoted as a dotted line. b Zoom into the rim with the filopodia at the border of the contact region in three-dimensional presentation. c Height profile of the filopodia along the white line in a
