
Figure 3.
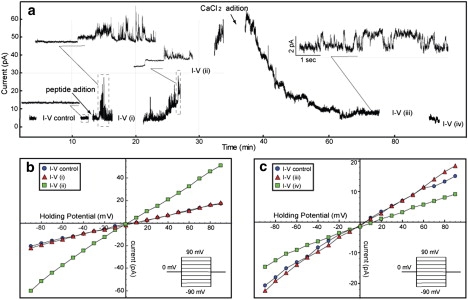
Current across a planar lipid bilayer under the same conditions as in Fig. 2, c and d. (a) An average over 10 measurements of current as a function of voltage that were carried out at six different time points: (I/V control) before adding the peptides, (I/V (i)) 10 min after adding the peptide, (I/V (ii)) 40 min after adding the peptide, (I/V (iii)) 30 min after adding CaCl2, and (I/V (iv)) 70 min after adding CaCl2. The inset pictures show amplified sections of the current trace; the scaled time fraction is enclosed by a dotted square, and when time and current are both scaled, the scale is included in the inset picture. (b and c) Average current as a function of voltage. The voltage is incremented by 10 mV between −90 mV to 90 mv and the potential is held for 150 ms at each voltage. The points in b and c are the average over 10 consecutive measurements taken at each of the intervals indicated in a. It can be seen that after the peptide is added, there are currents jumps before (I/V (i)), but there is not much difference in average between I/V control and (I/V (i)). However, after the permeabilization becomes permanent and the baseline current starts to increase, there is a marked increase in the slope of the current versus voltage (I/V (ii)) relative to the control I/V (I/V control). After addition of CaCl2, the ionic permeabilization reduces. In the last I/V record (I/V (iv)), the current is even lower than the control current. This indicates that CaCl2 reduces the permeability of the membrane to essentially zero.