
Figure 1.
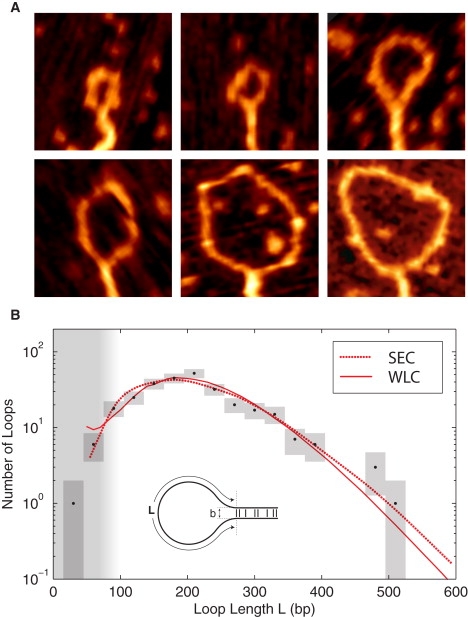
(A) Representative SFM images of H-NS-induced DNA loop complexes. The images are 125 nm by 125 nm. (B) The probability of H-NS-mediated DNA loops length L. A fit of the observed loop-length distribution (black), determined from SFM images of 286 loops, to the predicted loop-length distribution (red) results in excellent agreement with both chain statistics models. These fits predict nearly identical values for the adhesion energy: ρ = 0.13 ± 0.03 kT nm−1 (SEC) and ρ = 0.14 ± 0.03 kT nm−1 (WLC). The SEC model predicts a loop spacing of b = 4 ± 1 nm, whereas the WLC suggests a slightly higher value of b = 6 ± 1 nm . The chain statistical models are discussed in the Supporting Material. (The vertical range of the boxes represents the Poisson error, and the width represents the bin size.)