
Figure 2.
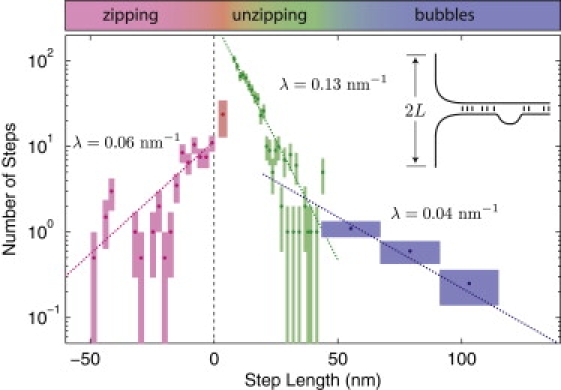
Step-size distribution for saturated, bridged duplexes upon optical-tweezers driven unzipping. In this assay, the step lengths are determined by the bridge spacing in the DNA–H-NS–DNA complex. The number of observed contour length steps is plotted as a function of the step length. The Poisson error is represented by the vertical box range. The bin size is represented by the box width. (Where the bin size has been expanded, the observed event number has been renormalized, resulting in fractional events.) The first step bridging probability (red) appears suppressed relative to the amplitude of subsequent steps in the unzipping regime which are well described by an exponential decay (green). The decay length fit from n > 1 steps is λ = 0.13 ± 0.02 nm−1.