
Figure 4.
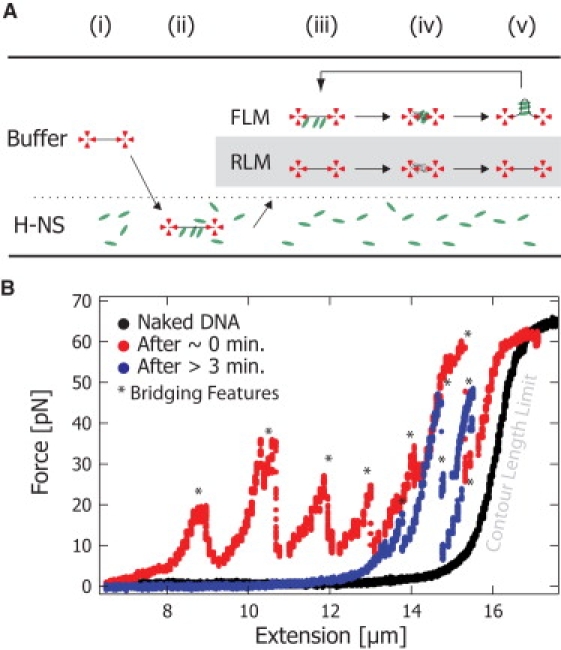
H-NS-DNA complex lifetime experiment. (A) A single DNA molecule is caught with optical tweezers. A force extension curve is taken in buffer solution (i). Subsequently, the DNA is “loaded” with H-NS in a buffer containing H-NS (2 μM) (ii). The DNA molecule is then placed back into the buffer solution without H-NS (iii). To probe the occurrence of bridge formation (and thus detect the presence of H-NS), the beads were brought together, releasing the DNA tension and allowing trans binding (iv). The force-extension curves were taken at time intervals of 1–5 min (iv→v→iii). The Rigid-Linker model (gray box) predicts that when the DNA is extended (iii), the lifetime of the H-NS-DNA complex is the lifetime of a single head (∼1 s). The Flexible-Linker model predicts that when the DNA molecule is extended (iii), the lifetime of the H-NS-DNA complex will be on order minutes due to the cooperative binding of the two heads. (B) The black curve shows the initial force-extension response of naked DNA. The red curve shows the force-extension response for the DNA immediately after incubation with H-NS. Bridging features are force spikes (∗) at extensions shorter than the contour length that result from large regions of trans-bound H-NS. After holding an extended state for >3 min, the blue curve still exhibits bridging features (∗) that demonstrate that H-NS remains bound to DNA for a lifetime an order of magnitude greater than predicted by the single-head off rate. These data strongly support the existence of cis-bound H-NS as predicted by the Flexible-Linker model.