Fig. 4.
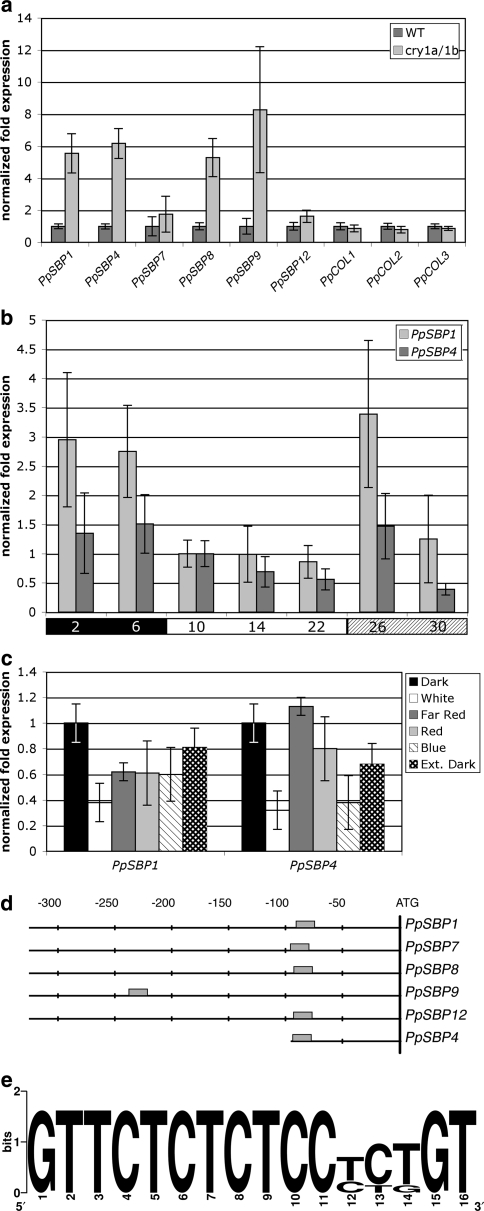
Responses of PpSBP1 and PpSBP4 to light and cryptochrome. a Relative quantification of transcript levels of PpSBP1, PpSBP4 and other members of the LG1-subfamily in 4-week-old LD cultures of wild type (WT) and of the ppcry1a/1b double disruptant line (cry1a/1b) at the end of the light period. Relative transcript levels of P. patensCONSTANS-like genes (PpCOL1 to -3) are shown for comparison. Expression in wild type is arbitrarily set at one. b Relative quantification of transcript levels of PpSBP1 and PpSBP4 in wild type during one full 8 h dark/16 h light cycle. The black and the white bars below the histogram indicate, respectively, the dark and light periods of the normal 24 h day. The shaded bar below the histogram marks the samples taken during extension of the white-light period. Numbers in the bars indicate isolation time points in hours after start of the night. Transcript levels are arbitrarily set at one at 10 h after start of the cycle, i.e. 2 h after start of the light period. c Relative quantification of transcript levels of PpSBP1 and PpSBP4 in wild type grown under different light qualities. Transcript levels in total RNA isolated 90 min before the subjective dawn (Dark) are arbitrarily set at one. Sampling in different light quality conditions was performed 90 min after the subjective dawn. d Schematic representation and alignment of the sequences upstream of the translational start codons in the Physcomitrella members of the LG1-subfamily of SBP-box genes. The grey box indicates the conserved motif shown in e. The positions, in nucleotides relative to the start codon (ATG), are shown above the alignment. e Nucleic acid sequence logo of the conserved motif found in the promoter region of the Physcomitrella LG1-subfamily members as identified by the program MotifSampler (Thijs et al. 2002). In the logo each stack corresponds to one position in the sequence. The overall height of a stack indicates the sequence conservation at that position, while the height of symbols within the stack indicates the relative frequency of each nucleotide at that position (Crooks et al. 2004)

