
Figure 2.
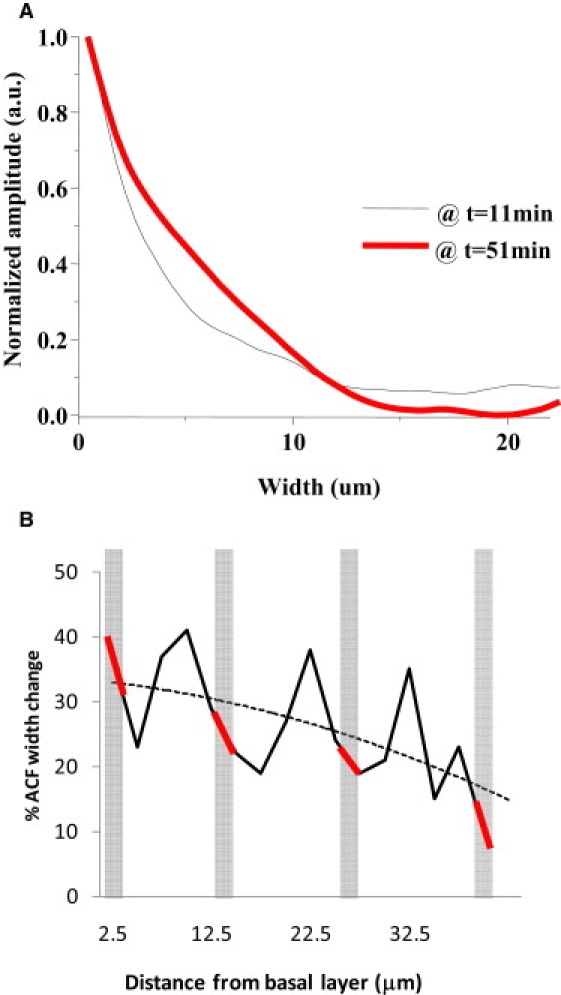
(A) Normalized horizontal section of the spatial autocorrelation function (spatial ACF) as a function of pixel shift (in μm). The width of the spatial ACF is proportional to the average size of cells in the observed region and in the observed plane. Using one-photon microscopy, the observed area at the leading edge of migration was ∼0.25 mm2. The spatial ACF were calculated using the ICS algorithm at 11 and 51 min post injury. (B) Data from Table 1. The oscillations in the width of the ACF correspond to the different cell layers. There is an overall trend (dotted line) of the width change as a function of the height above the basal layer. The shaded rectangles indicate the height at which the velocity of the cell layer is calculated.