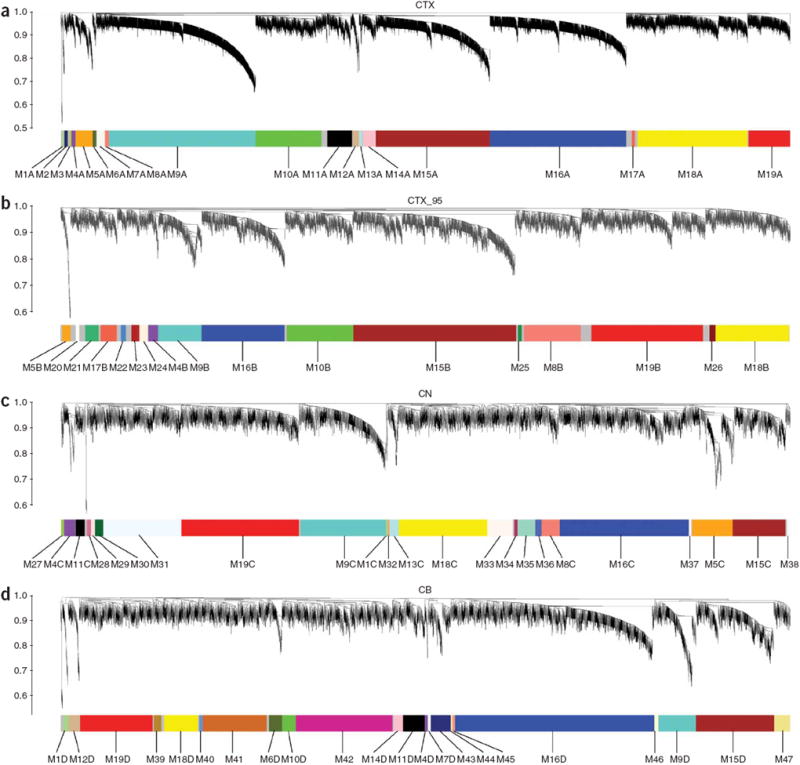
Figure 1.

Network analysis of gene expression in human cerebral cortex, caudate nucleus and cerebellum identifies distinct modules of coexpressed genes. (a–d) Dendrograms produced by average linkage hierarchical clustering of genes on the basis of topological overlap (Methods). Modules of coexpressed genes were assigned colors and numbers as indicated by the horizontal bar beneath each dendrogram. Modules from different networks with significant overlap (corrected hypergeometric P < 0.05) were assigned the same color and number, with networks denoted by letters (for example, M9A for CTX, M9B for CTX_95, M9C for CN and M9D for CB). We used 67 samples and 5,549 probe sets for CTX (a), 42 samples and 3,203 probe sets for CTX_95 (b), 27 samples and 4,050 probe sets for CN (c), and 24 samples and 4,029 probe sets for CB (d). Samples from a, c and d were analyzed on Affymetrix U133A microarrays, whereas samples from b were analyzed on Affymetrix U95A/v2 microarrays.
