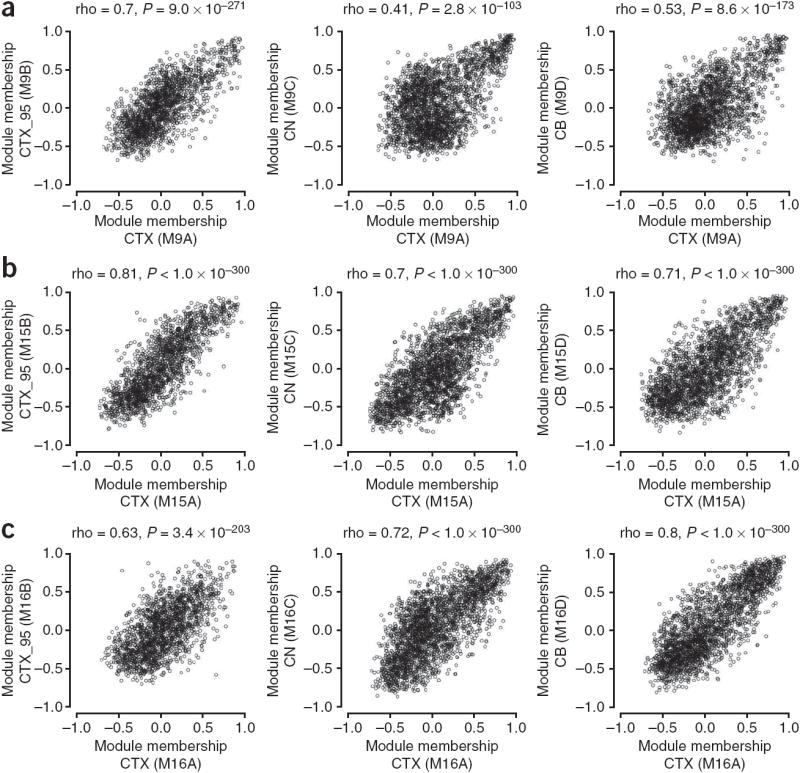
Figure 3.

Module membership is highly correlated in multiple human brain networks. (a–c) Comparison of module membership between networks for M9 (a), M15 (b) and M16 (c). For each module, the correlation (Spearman) between module membership for CTX and CTX_95, CTX and CN, and CTX and CB was assessed. Module membership was correlated for the intersection of all probe sets or genes used to construct the networks depicted in Figure 1 (CTX versus CTX_95, 1,805 genes; CTX versus CN, 2,542 probe sets; CTX versus CB, 2,374 probe sets).
