
Figure 5.
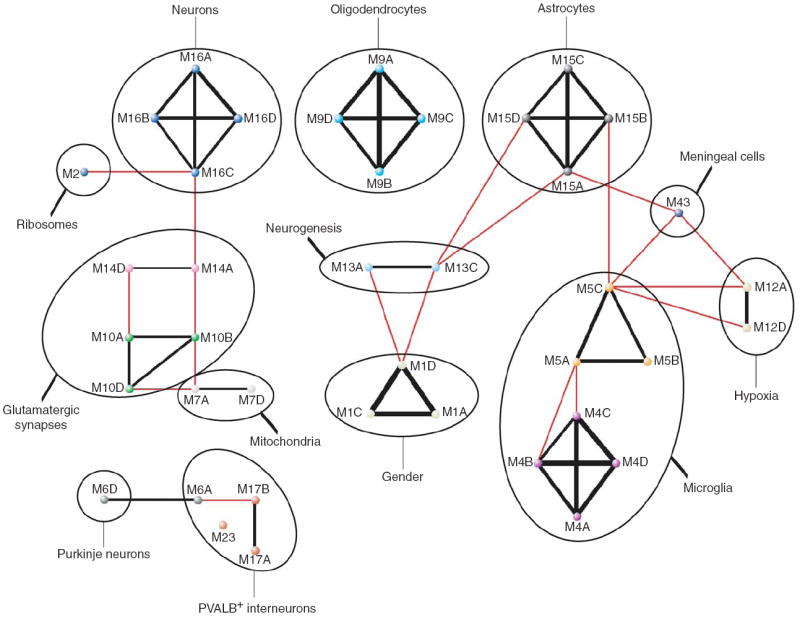
Overlap and functional characterizations reveal a meta-network of gene coexpression modules in the human brain. Summary of module characteristics and overlap. Black lines connect modules from different networks with significant overlap (corrected hypergeometric P < 0.05) that were assigned the same color and number, with the width of the line corresponding to the extent of the overlap; red lines connect modules from different networks with significant overlap that were assigned different colors and numbers (Supplementary Table 2 and Methods).