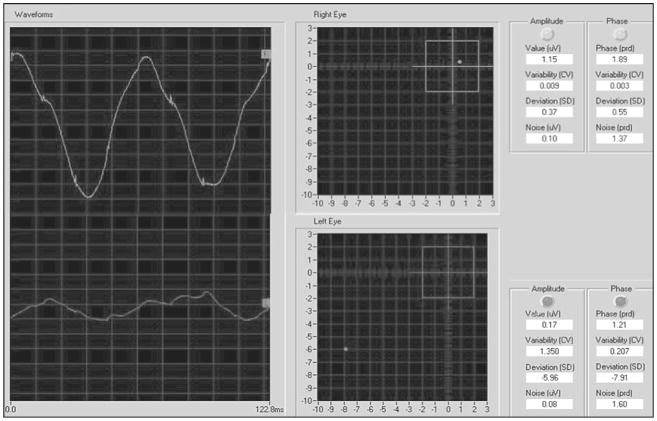
Figure 2. Example of normal PERG (right eye, upper left) and abnormal PERG (left eye, bottom left).
PERGs have an approximately sinusoidal waveform, whose frequency corresponds to the reversal rate. The analyzed period (122.8 ms) exactly corresponds to two contrast reversals. PERG waveforms are automatically analyzed by Digital Fourier Transform to isolate the PERG sinusoidal component (16.6 Hz) from the background noise, and measure its amplitude in microvolts and phase in radians (latency) (right-hand tables). Amplitude and phase are also expressed in standard deviations (SDs) from age-corrected normal averages (right-hand tables) and plotted one against the other in a polar diagram (center panels). The box in the polar diagram represents the 95% (±2 SD) tolerance interval for amplitude (vertical) and phase (horizontal). In the example, the right eye has an amplitude and phase close to the age-corrected normal average. The left eye has a reduced amplitude (about −6 SDs from normal) and a delayed phase (about −8 SDs from normal). The program also calculates an index of intrinsic variability (coefficient of variation (CV) between the amplitude and phase recorded during the first 1.5 minutes and the second 1.5 minutes of the acquisition) and an index of a noise response (amplitude and phase of a difference waveform between the first 1.5 minutes and the second 1.5 minutes of the acquisition).

