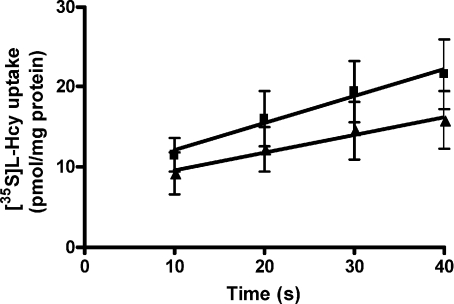
Figure 5. Linearity of [35S]l–Hcy uptake into MVM vesicles.
Uptake of 10 μm[35S]l–Hcy into MVM vesicles in the presence (▪) or absence (▴; with K+ replacement) of an inwardly directed Na+ gradient over 10–40 s. Linear regression plot is shown (r2 > 0.97, P < 0.05 for both conditions). Data are presented as mean ±s.e.m. (n= 6).

