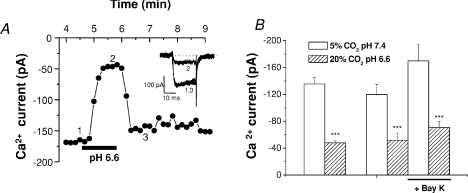
Figure 5. Effect of hypercapnic acidosis on chemoreceptor cell calcium currents.
A, time course of calcium current amplitude evoked in a chemoreceptor cell by application of successive voltage pulses to −10 mV (pulse duration 20 ms; pulse frequency 0.1 Hz; Vhold=−80 mV) during superfusion with control and acidic/hypercapnic solutions (20% O2–5% CO2 and 20% O2–20% CO2 equilibrated media, respectively). The inset shows sample current traces at the times indicated (1, 2 and 3). B, mean calcium current amplitude found in 12 chemoreceptor cells recorded with the protocol shown in A (left two bars). Right four bars show mean current amplitudes obtained in 5 chemoreceptor cells recorded with an identical protocol in the absence and presence of 1 μm Bay K 8644. Data are means ±s.e.m.; ***P < 0.001.

