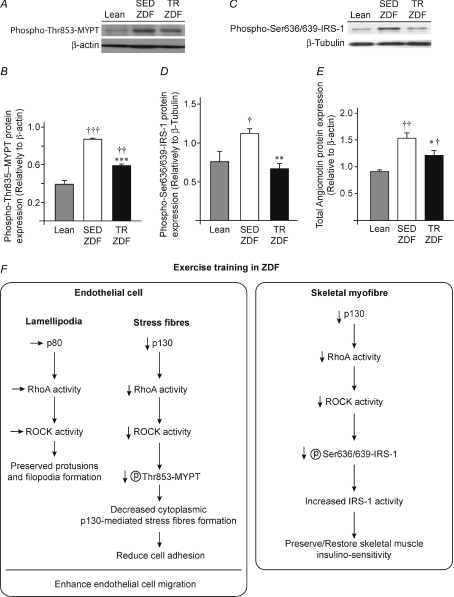
Figure 6. MYPT and IRS-1 activation.
A, representative Western blots for phospho-MYPT on serine 853 in plantaris muscles from Lean, sedentary (SED) or trained (TR) ZDF rats. β-Actin protein detection was used as a loading control. B, densitometric analysis of phospho-MYPT protein expression. C, representative Western blots for phospho-IRS-1 on serine 636/639 in plantaris muscles from Lean, sedentary (SED) or trained (TR) ZDF rats. αβ-Tubulin protein detection was used as a loading control. D, densitometric analysis of phospho-IRS-1 serine 636/639 protein expression. E, total angiomotin expression (p80+p130) in Lean, SED-ZDF and TR-ZDF. Data obtained from densitometric analysis represented in Fig. 4D. Data in all panels are presented as means ±s.e.m. (n= 9 Lean, n= 8 SED-ZDF, n= 8 TR-ZDF). Significant effect of exercise training: *P≤ 0.05; **P≤ 0.01; ***P≤ 0.001. Significantly different from Lean: †P≤ 0.05; ††P≤ 0.01; †††P≤ 0.001. F, potential mechanism by which exercise training might affect angiomotin/RhoA/ROCK signalling pathway.

