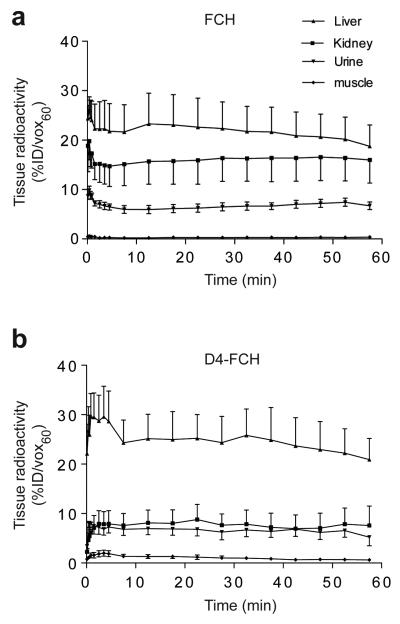
Figure. 3.
Tissue profile of FCH and D4-FCH. (a) Time versus radioactivity curve for the uptake of FCH in liver, kidney, urine (bladder) and muscle derived from PET data, and (b) corresponding data for D4-FCH. Results are the mean ± SE; n = 4 mice. For clarity upper and lower error bars (SE) have been used.

