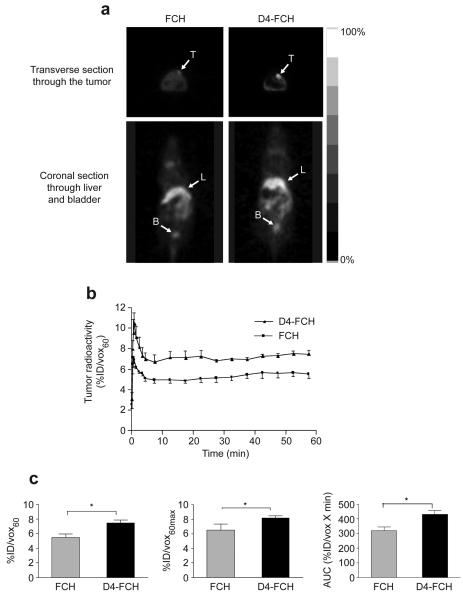
Figure 4.
Tumor profile of FCH and D4-FCH in SKMEL28 tumor xenograft. (a) Typical FCH-PET and D4-FCH-PET images of SKMEL28 tumor-bearing mice showing 0.5 mm transverse sections through the tumor and coronal sections through the bladder. For visualization, 30 to 60 min summed image data are displayed. Arrows point to the tumors (T), liver (L) and bladder (B). (b). Comparison of time versus radioactivity curves for FCH and D4-FCH in tumors. For each tumor, radioactivity at each of 19 time frames was determined. Data are mean %ID/vox60 mean ± SE (n = 4 mice per group). (c) Summary of imaging variables. Data are mean ± SE, n = 4; *P = 0.04. For clarity upper and lower error bars (SE) have been used.

