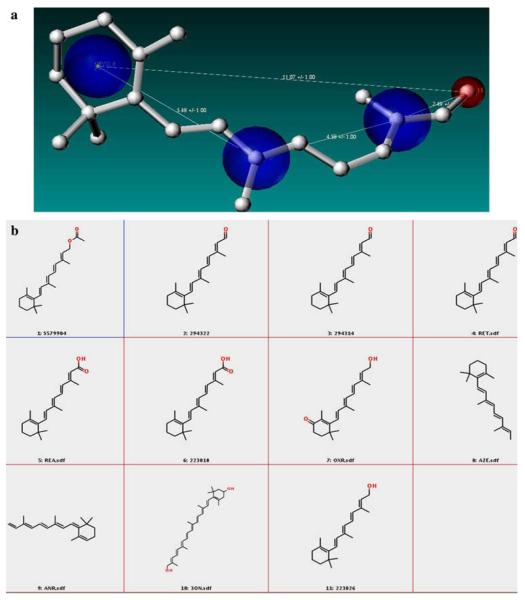
Fig. 5.
(a) Schematic representation of the combined pharmacophore for retinal in the binding pocket of bovine rhodopsin. The ligand retinal is depicted as ball and stick and colored grey. Blue spheres indicate regions of the ligand strictly interacting with hydrophobic residues and the red sphere indicates a steric interaction signifying the covalent linkage between C15 of the ligand and LYS296 of the receptor. The pharmacophore is shown along with the distance constraints. (b) 2D representations of various retinal analogues that were retrieved from the enriched database using the combined pharmacophore. Note that all the molecules shown here strictly follow the pharmacophore and skeletal structure of the query ligand retinal

