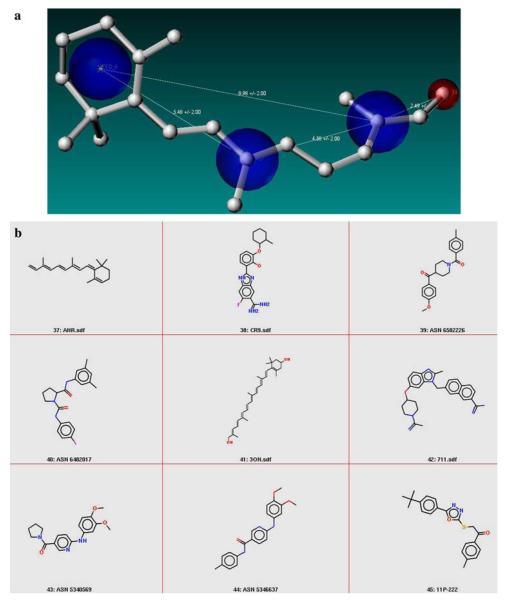
Fig. 6.
(a) Schematic representation of the relaxed combined pharmacophore for retinal is shown. Note the change in shape of the pharmacophore and relaxing the distance constraints leads to a selection of a larger number of molecules that have more variations in the skeletal structure. (b) 2D representations of some of the molecules that were retrieved based on the relaxed combined pharmacophore. A total of 110 molecules were retrieved from the enriched database

