
Figure 2.
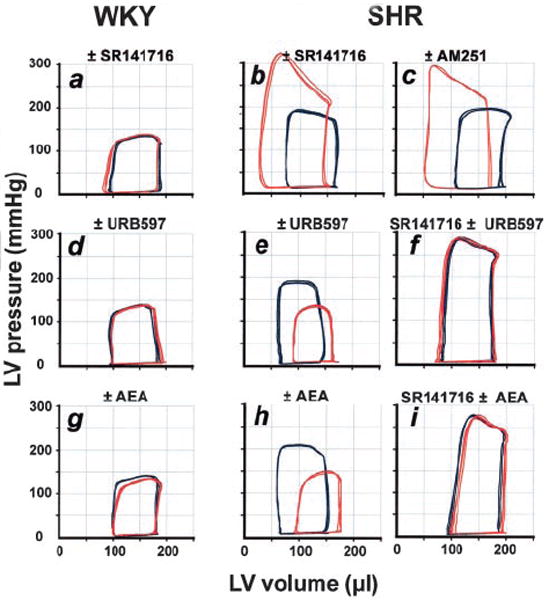
Representative LV pressure-volume loops from WKY (a, d, g) and SHR (b, c, e, f, h, i) before (blue) and after (red) treatment with indicated agents or their combinations (for doses, see text). Experiments were repeated in 3 more animals in each treatment group with similar results. AEA indicates anandamide.