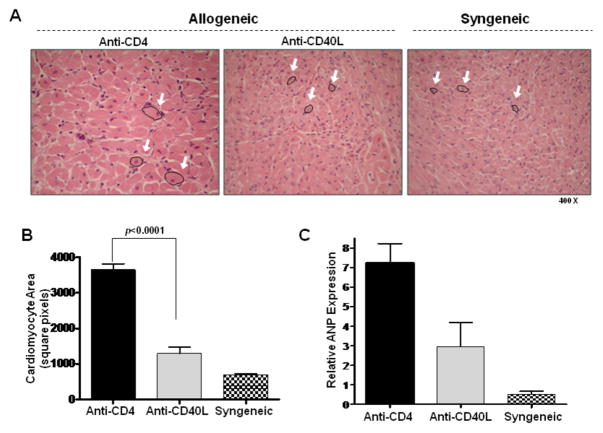
Figure 3. Histologic confirmation of cardiac hypertrophy in CR grafts.
(A) H&E stains of day 30 post transplant cardiac allografts taken from recipients transiently depleted of CD4+ cells (Anti-CD4) or recipients receiving anti-CD40L mAb therapy (Anti-CD40L) as well as syngeneic control graft recipients. Arrows highlight representative cardiac myocytes. (B) Cardiomyocyte areas were quantified using morphometric analysis. Bars represent mean + S.E.M. of area measurements taken from at least 80 cardiomyocytes per heart from 5 different hearts per group. (C) Intragraft message levels of atrial natriuretic peptide (ANP), a marker of cardiac hypertrophy, were measured with quantitative real time PCR in cardiac grafts from recipients in (B) at day 30 post transplant. Bars represent mean + S.E.M. of 3–5 grafts per group.

