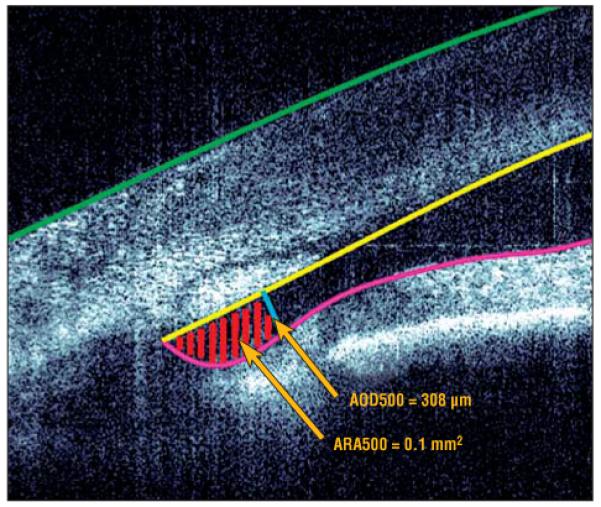
Figure 4.

Representative narrow angle measurement. The epithelium, endothelium, and iris were manually delineated in unprocessed coordinates. The angle opening distance at the 500-μm (AOD500) line is shown in blue, and the angle recess area at the 500-μm (ARA500) region is hatched with red lines in unprocessed coordinates. The values for the AOD500 and ARA500 were calculated in processed coordinates, and the ARA500 was obtained by integration of the equations describing the lines.
