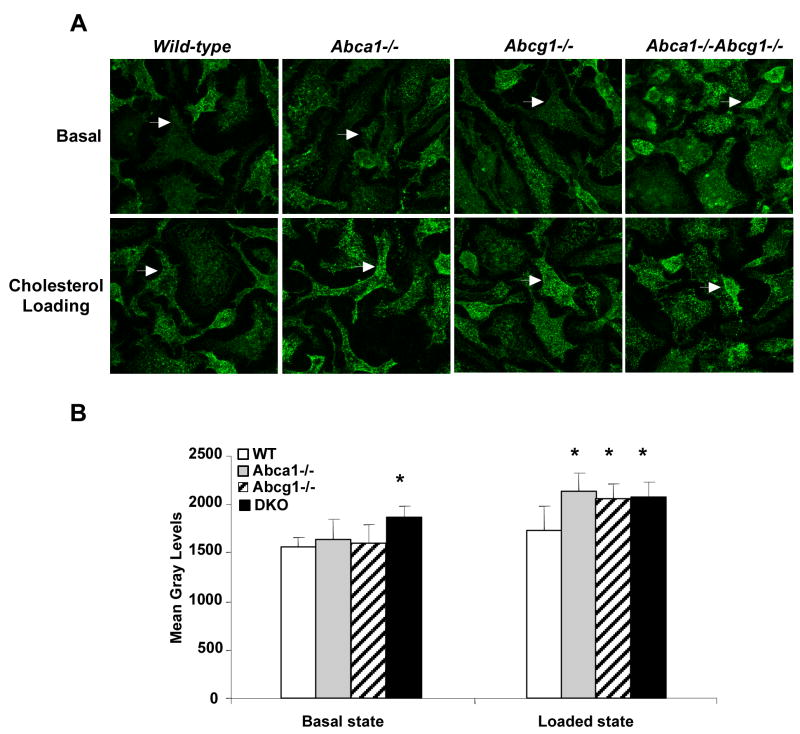
Figure 3. Visualized lipid rafts in Abca1−/−, Abcg1−/− and Abca1−/−Abcg1−/− macrophages.
Bone marrow-derived macrophages from mice on mixed background C57BL/6 × DBA were cultured in 0.2% BSA DMEM (Basal) or loaded overnight with 50μg/mL acLDL plus 3μmol/L TO901317 compound (Loaded state). Plasma membrane raft structures were labeled for ganglioside GM1 and visualized by confocal microscopy as described in methods. Images represent a 3D re-construction from the z-stack of image slices (A). Quantification was performed using ImageJ software and expressed as mean gray levels (B). Values are mean ± SD. *P< 0.05 vs. WT.

