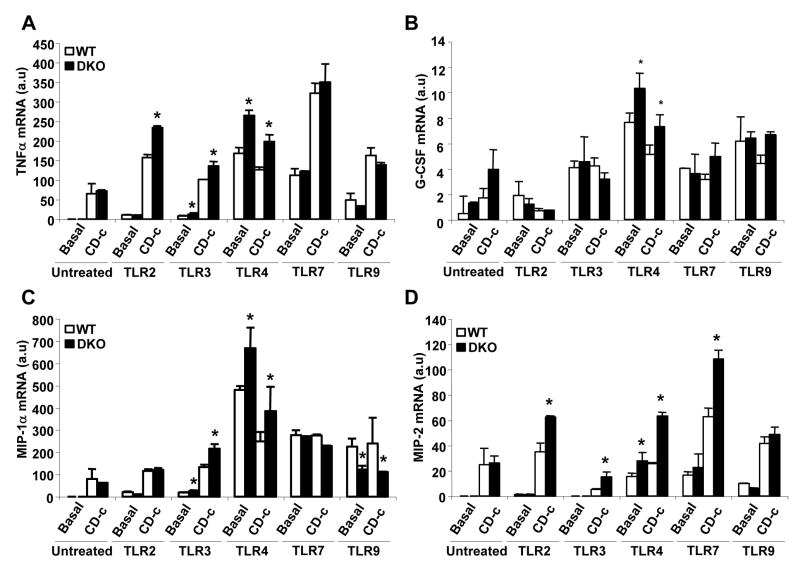
Figure 5. Increased response to TLR2, TLR3 and TLR4 ligands in Abca1−/−, Abcg1−/−and Abca1−/−Abcg1−/− macrophages.
Bone marrow-derived macrophages from mice on mixed background C57BL/6 × DBA were incubated in 10% FBS DMEM (basal) or with CD-cholesterol (CD-c, 2.5:1 molar ratio) for 4 hours in presence of different TLR ligands: TLR2 ligand (peptidoglycan, PGN, 2.5μg/mL), TLR3 ligand (PolyI:C, 2.5μg/mL), TLR4 ligand (LipidA, 100ng/mL), TLR7 ligand (Gardiquimod, 2.5μg/mL) and TLR9 (Bacterial CpG-DNA, 2.5μg/mL). Inflammatory transcript levels were quantified and normalized to β-actin RNA amount. mRNA levels of TNFα (A), G-CSF (B), MIP-1α (C) and MIP-2 (D) were expressed as arbitrary units (a.u). Values are mean ± SEM. *P< 0.05 vs. WT.

