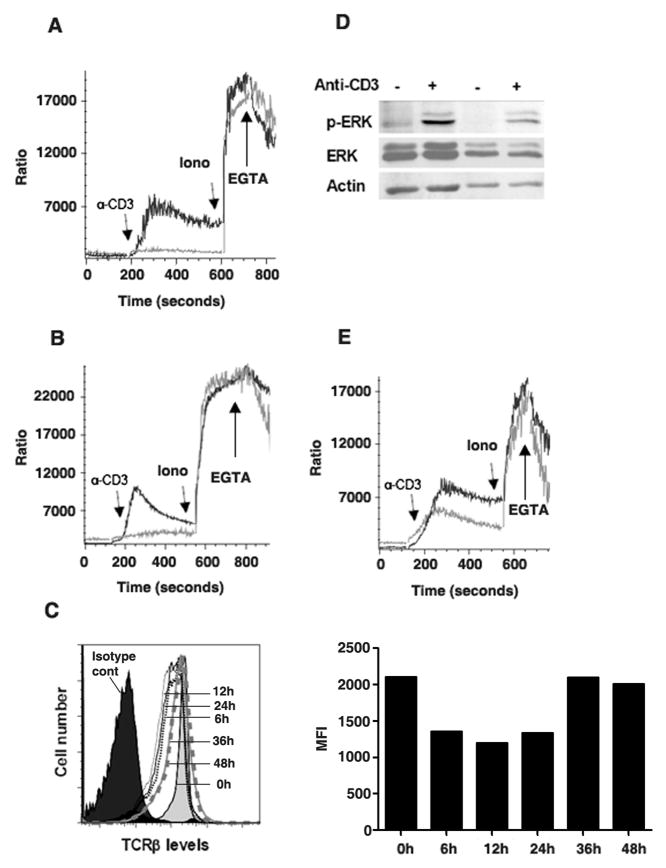
Fig. 3. TCR ligation fails to induce Ca++ flux in activated CD4 T cells.
(A) Unstimulated CD4 T cells (black line), or CD4 T cells activated with anti-CD3/anti-CD28 mAbs for two days (gray line), were loaded with Indo-1 and examined for Ca++ flux by flow cytometry in response to anti-CD3 mAb (α-CD3), Ionomycin (Ion) or EGTA. Arrows indicate the time when each reagent was added. (B) Unstimulated CD8 T cells (black line) or CD8 T cells activated (gray line) as in (A) were loaded with Indo-1 and examined for Ca++ flux by flow cytometry in response to anti-CD3 mAb. (C) TCRβ expression in CD4 T cells unstimulated (0h), activated for 6, 12, 24, 36 or 48h with anti-CD3 and anti-CD28 mAbs was examined by flow cytometry. Mean fluorescence intensity (MFI) of the TCR is also shown (right panel). (D) Unstimulated or activated CD4 T cells were treated with medium or anti-CD3 mAb for 5 min and phosphorylated ERK (p-ERK), total ERK and actin were examined by Western blot analysis. (E) CD4 T cells isolated from wildtype (black line) or Ets-1 deficient (gray line) mice were loaded with Indo-1 and examined for Ca++ flux by flowcytometry in response to anti-CD3 mAb.

