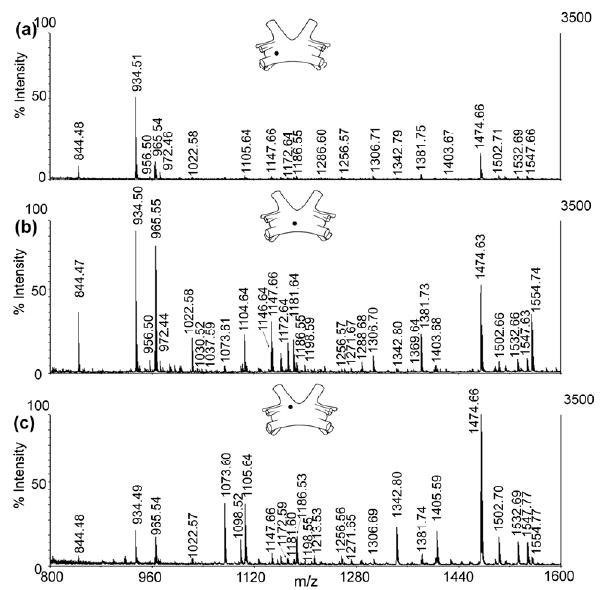
Figure 2.

Comparison of direct tissue mass spectra from three discrete regions of C. borealis brain. The solid dark circle indicates the position of tissue in the whole brain structure including (a) medium protocerebrum (MPC), (b) deutocerebrum (DC) and (c) tritocerebrum (TC) from which MS spectrum was acquired.
