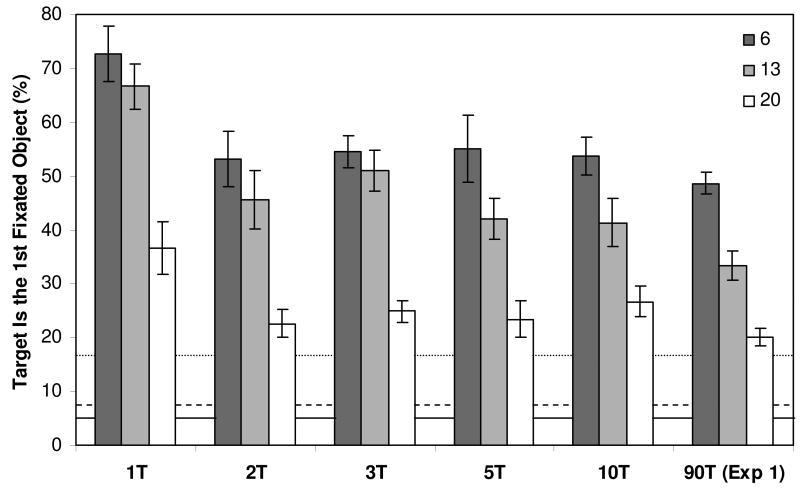
Figure 6.
Percentage of Experiment 2 target present trials in which the first fixated object was the target, grouped by repetition condition. Dotted, dashed, and solid lines indicate chance levels of guidance in the 6, 13, and 20 set size conditions, respectively. Error bars indicate standard error.

