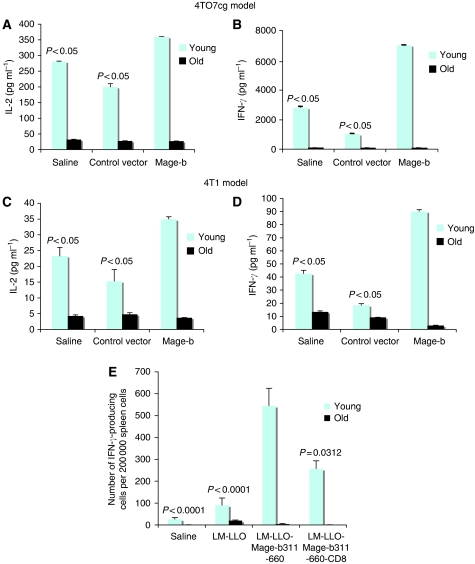
Figure 4.
Mage-b-induced immune responses (in vitro) at young and old age in the 4TO7cg and 4T1 model. Mage-b-induced immune responses were determined at young and old age. Mice were vaccinated (pcDNA3.1-Mage-b) and challenged with 4TO7cg or 4T1 tumour cells, as shown in Figure 1A or B, respectively. Cells from spleens were transfected with Mage-b DNA, and draining LNs were re-stimulated with syngeneic 64pT breast tumour cells, highly expressing Mage-b. The production of IL-2 by cells in the spleen (A and C) and of IFNγ by cells in the draining lymph nodes (LNs) (B and D) of vaccinated and control mice was determined by quantitative ELISA. Controls such as nonstimulated cells from spleens or draining LNs were negative (data not shown). All experiments were performed in triplicate and subjected to statistical analysis using the Tukey–Kramer Multiple Comparison test (P<0.05 is significant). The cytokine levels produced in the Mage-b group were compared with those produced in the saline and vector control groups. At young age n=10 mice per group, and at old age n=15. Mice were also vaccinated with LM-LLO-Mage-b311–660 and challenged with 4T1 tumour cells, as shown in Figure 1C. Cells from spleens were re-stimulated with bone marrow cells transfected with pcDNA3.1-Mage-b and pCMV1-GM-CSF plasmid DNA. Two days later, Mage-b-specific immune responses were analysed by ELISPOT (E). Involvement of Mage-b-specific CD8 T cells was determined by negative depletion, using magnetic beads with anti-CD8 antibodies. Controls such as BM cells transfected with pcDNA3.1-Mage-b or with pCMV-GM-CSF, and nontransfected BM cells were negative (data not shown). All experiments were performed in triplicate. n=5 mice per group, and were used once. Results were averaged and subjected to statistical analysis using the Mann–Whitney test (P<0.05 is significant). The number of IFNγ-producing cells in the Mage group was compared with that in the saline and vector control groups. In all figures, cells from spleens or draining LNs were pooled; error bars represent the s.e.m.

