
Graph 1. Alcohol related cancers mortality rates1 (per 100,000 person years) by education, per population.
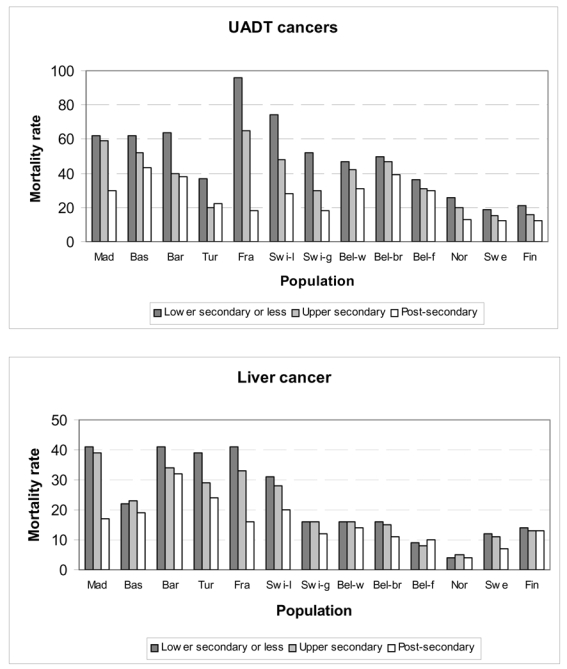
1: Age-standardized mortality rate using direct standardization, per 100,000 person years
Note: UADT cancers group cancers of oral cavity, pharynx, larynx and esophagus.
Swi-l and Swi-g correspond to the Latin part and the German part of Switzerland. Bel-w, Bel-br and Bel-f correspond to the Walloon part of Belgium, Brussels and the Flemish part of Belgium.