
Figure 2.
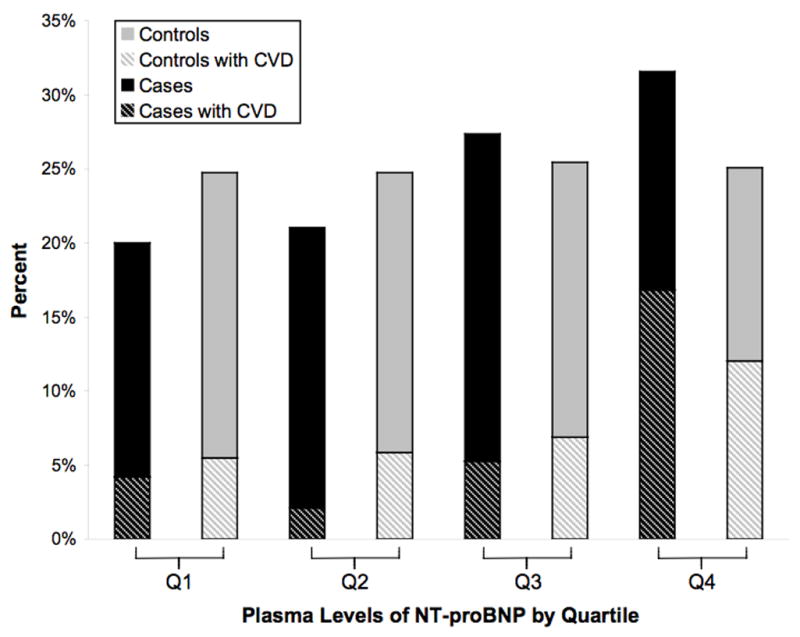
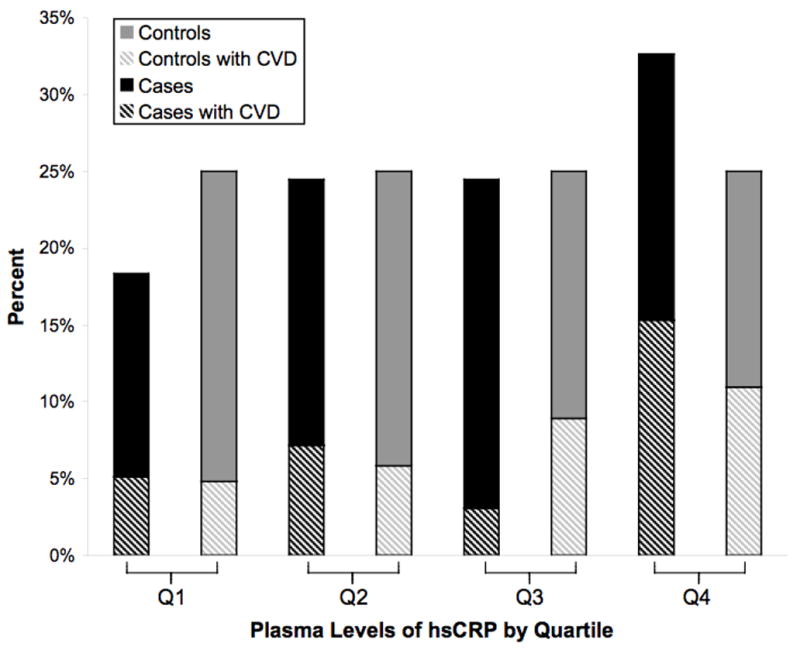
A and B: Proportion of SCD cases and controls within each quartile of NT-proBNP (A) and hsCRP levels (B) in patients with CVD at baseline. The dark bars represent SCD cases and the light bars represent controls, and the hatched bars denote the proportion who reported a prior history of CVD