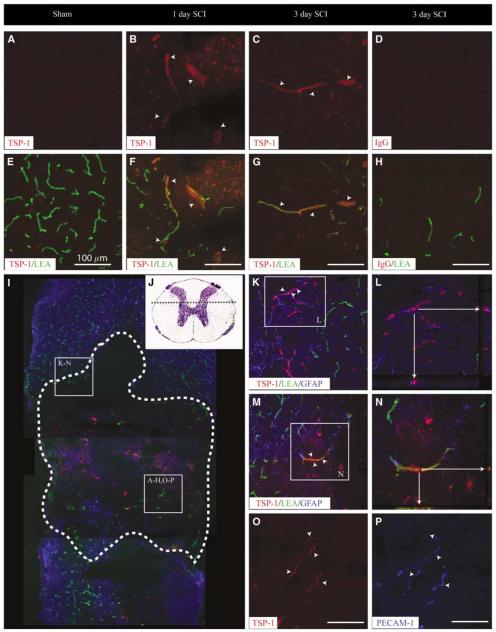
Figure 5.
Thrombospondin 1 protein levels are acutely increased in ECs after SCI. In the uninjured spinal cord, no TSP-1 expression is observed in perfused microvascular profiles (A, E). By 1 day after SCI, TSP-1 immunoreactivity is observed and is associated with spinal microvessels (B, F). This vascular expression pattern is maintained through 3 days after injury (C, G). Laser confocal microscopic examination of the immunoreactive signal for TSP-1 in spinal microvessels 24 h after SCI shows an EC localization, which is apparent in microvessels with and intact astroglial investment (K, L) as well those found in the epicenter tissue devoid of astrocytes (M, N). Interestingly, TSP-1 expression is observed in microvascular elements lacking binding of the perfusion marker (L, arrowheads) but is shown to be vascular profiles as determined by the colocalization of TSP-1 with the microvascular EC marker PECAM-1 in LEA-negative profiles (O, P; arrowheads). Thrombospondin 1-immunopositive microvessels are observed at both the injury epicenters (A to H, O to P) as well as in penumbral zones (K to N). A representative photomicrograph of the longitudinal view of the lesion at 24 h after SCI (I, dashed outline) illustrated the relative hypovascularity at the contusion site as compared with the spared spinal parenchyma. The spinal cord area represented in high-magnification photomicrographs is illustrated by the histologic preparation (J, dashed line). All scale bars = 100 μm.

