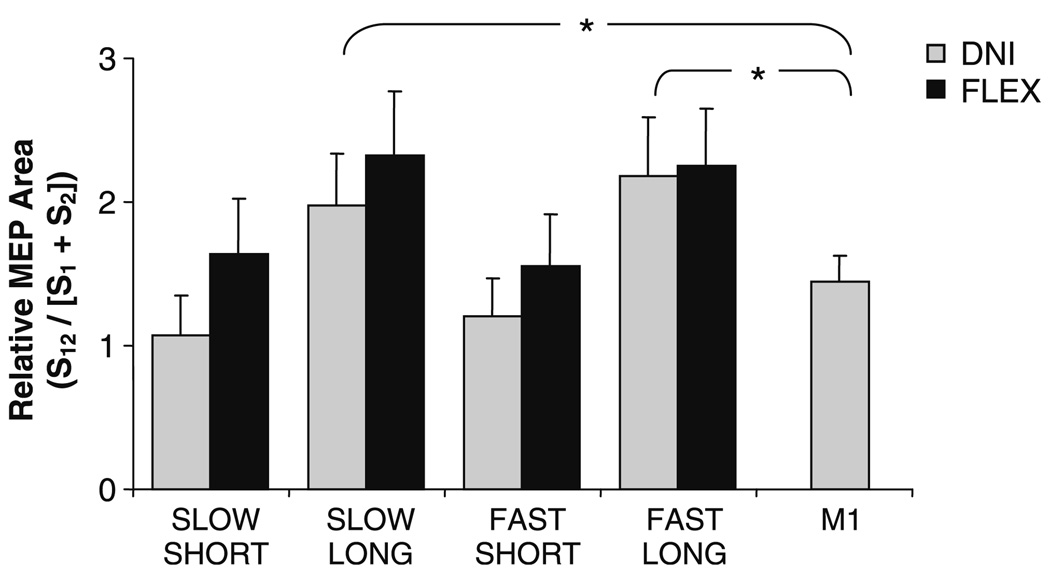
Fig. 6.
Group results showing relative motor evoked potential (MEP) area when the response was timed to arrive at the onset of the M2. MEP area is expressed relative to the sum of the stretch reflex (S1) and MEP (S2) areas when presented alone. Also shown is the normalized MEP size when the MEP was timed to arrive at the onset of the M1 (250 mm/s, 60 ms perturbation). *P < 0.05. Error bars represent one standard error of the mean

