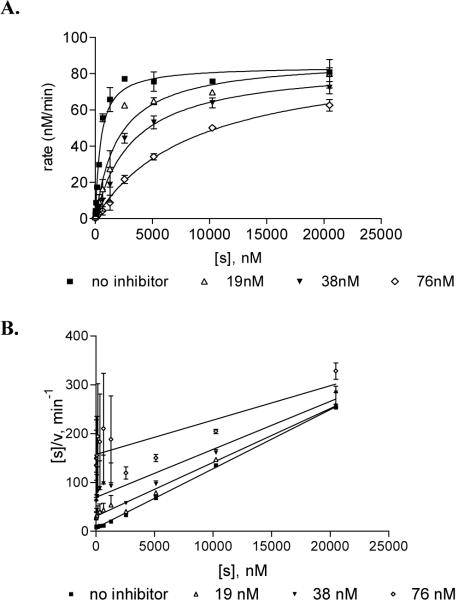
Figure 3.
M.HhaI inhibition by 2P-ODN. Reactions containing 8.6 nM M.HhaI, 2.4 μM [methyl-3H]AdoMet, and indicated amounts of 2P-ODN inhibitor were incubated with increasing concentrations of substrate. The rate of incorporation of methyl-3H was determined by liquid scintillation counting. (A) For each concentration the rate was plotted versus the inhibitor concentration. See Figure S2, Supplemental Material for corresponding Lineweaver-Burk plot. (B) A Hanes-Woolf plot of the same rate data. Kinetic determinants extrapolated from each plot are discussed (See Materials and Methods for details). Each reaction was performed in duplicate. Error bars indicate standard error from the mean of three independent experiments.

