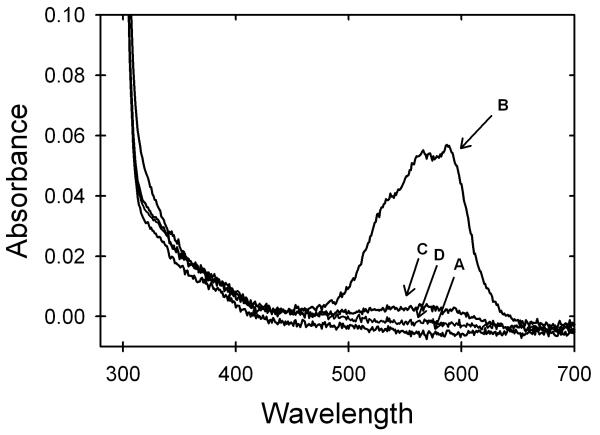
Figure 4.
Visible absorbance spectra of AS-SOD in 20mM HEPES, pH 7.2, at room temperature. Traces shown are protein with (A) no metal added, (B) after addition of 1 cobalt ion per monomer, (C) after pre-incubation of protein with 1 zinc ion per monomer followed by the addition of 1 cobalt ion per monomer, and (D) after pre-incubation with 6 zinc ions per monomer followed by the addition of 1 cobalt ion per monomer. The protein concentration for all four traces was 123 μM.

