
Figure 2.
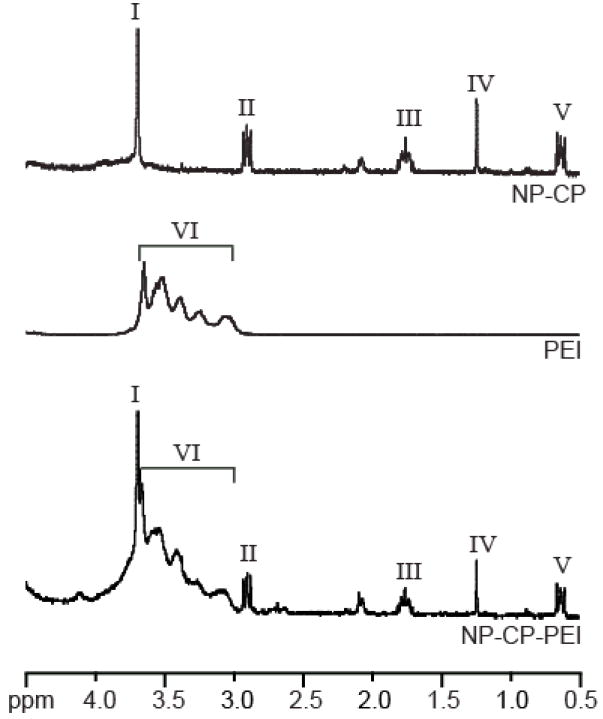
Proton NMR analysis of NP-CP, PEI, and NP-CP-PEI showing the incorporation of PEI onto NP-CP. The characteristic peak of the –O–CH2–CH2– group of PEG (peak I) on NP-CP and –NH2–CH2–CH2– group of PEI (peak II) are all present in the NP-CP-PEI spectrum. All samples were analyzed in D2O.