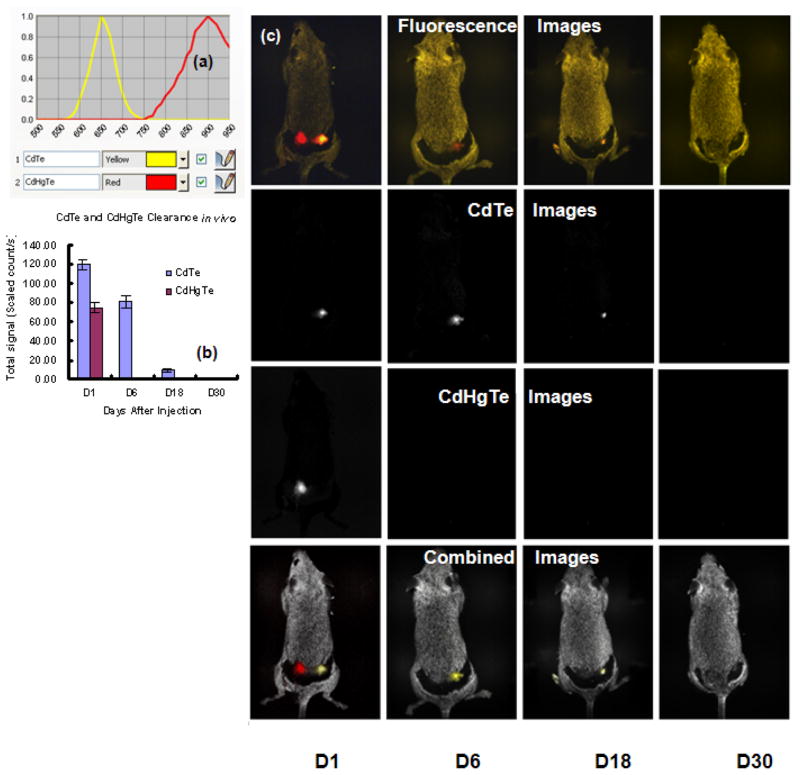
Figure 3.
(a) Fluorescence spectra of CdTe and CdHgTe QDs; (b) CdTe and CdHgTe clearance in vivo; (c) First row: Fluorescence images of grey mouse following subcutaneous injection of 50 μL CdHgTe (left fluorescent spot) and CdTe (right fluorescent spot) QDs observed at 1, 6, 18 and 30 days; Second row: Spectrally unmixed images to show CdTe; Third row: Spectrally unmixed images showing CdHgTe QDs. Fourth row: Combined images of CdTe and CdHgTe overlaid on autofluorescence.

