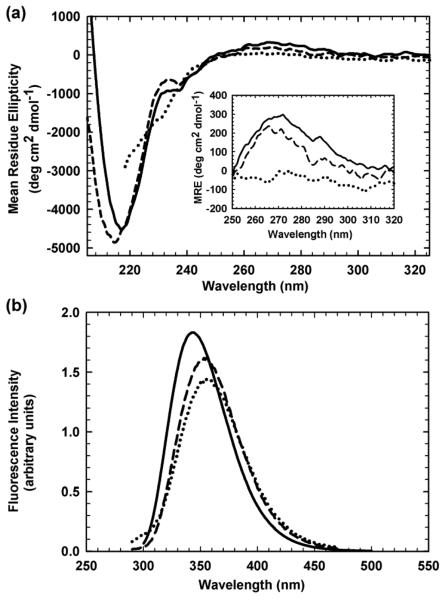
Figure 2.
CD and FL spectral characteristics of HIV-PR* and mHIV-PR*. (a) CD spectra and (b) FL emission spectra of HIV-PR*, residues 1-99, (solid lines) and mHIV-PR*, residues 1-95, (dashed lines). The CD and FL spectra of unfolded HIV-PR* and mHIV-PR* in 6 M urea (dotted lines) are coincident. Protein concentration was 5 μM in terms of monomer, and the buffer conditions were 100 μM sodium phosphate, pH 6.0, and 0.2 mM EDTA at 25 °C. The near-UV CD spectra of HIV-PR* (30 μM), mHIV-PR* (8 μM), and unfolded HIV-PR* in 6 M urea are shown as an inset in Figure 2a.

