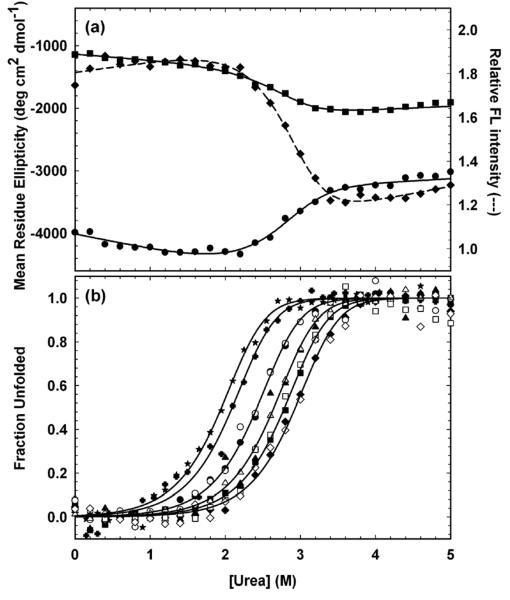
Figure 3.
Equilibrium folding properties of HIV-PR*. (a) Equilibrium unfolding monitored by CD at 220 nm (circles) and at 230 nm (squares) and by FL at 350 nm (diamonds) at 30 μM HIVPR*. Lines represent local fits to the two-state model, 2U ⇆ N2. Protein concentration in monomer units was 30 μM. (b) Fraction unfolded protein (Fapp) plots of the SVD vectors extracted from equilibrium unfolding CD (open symbols) and FL (filled symbols) spectra fit globally to the two-state model, 2U ⇆ N2. Protein concentrations, expressed in terms of monomer, are 0.5 μM (stars), 1 μM (crosses), 5 μM (circles), 15 μM (triangles), 30 μM (squares), and 60 μM (diamonds). Buffer conditions are described in the caption to Figure 2.

