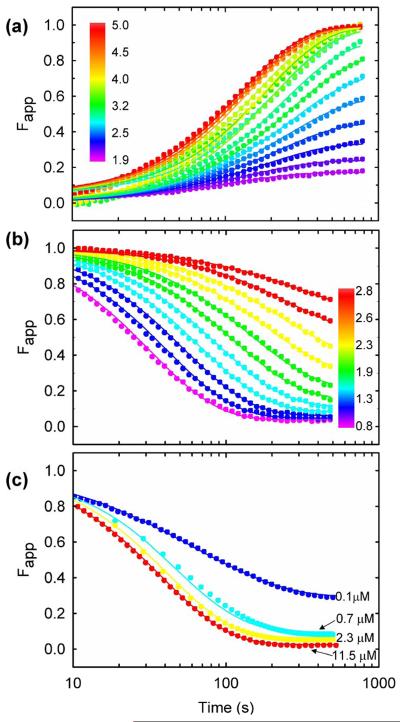
Figure 5.
Global analysis of HIV-PR* folding kinetics monitored by SF-FL. Representative fits of the data to the 2U ⇆ 2M ⇆ N2 model are shown. (a) Unfolding kinetics between 1.9 M and 5.0 M urea at 4 μM protease. (b) Refolding kinetics between 0.8 M and 2.8 M urea at 4 μM protease. (c) Refolding kinetics to 1.0 M urea at increasing protein concentrations. The signals are normalized to the extrapolated values for the native (yN) and unfolded (yU) protein, Fapp(t)=(y(t)-yN)/(yU-yN). Buffer conditions are described in the caption to Figure 2.

