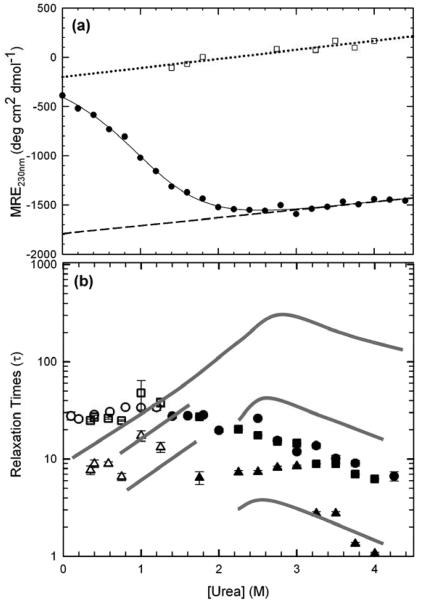
Figure 7.
Folding properties of mHIV-PR*. (a) Equilibrium unfolding transition of 10 μM mHIV-PR* monitored by CD at 230 nm (filled circles). Initial kinetic amplitudes for unfolding jumps (open squares) provided a native baseline by linear extrapolation. (b) Comparison of the mHIV-PR* chevron, by manual-mixing CD (circles) and stopped-flow FL (slow phase (squares) and fast phase (triangles)), with the HIV-PR* chevron shown as lines. Unfolding and refolding kinetics are represented with closed and open circles, respectively. Buffer conditions are described in the caption to Figure 2.

