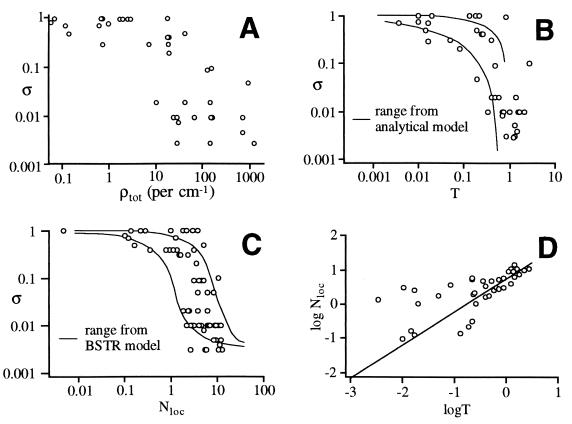
Figure 1.
Experimental dilution factors σ correlated with different molecular quantities. (A) Plotted vs. the total density of states. (B) plotted vs. T, an analytical local coupling strength. (C) plotted vs. Nloc, a computational local number of coupled states. (D) Correlation between Nloc and T. Because T and σ extend over several orders of magnitude, all plots are shown on log–log scales.

