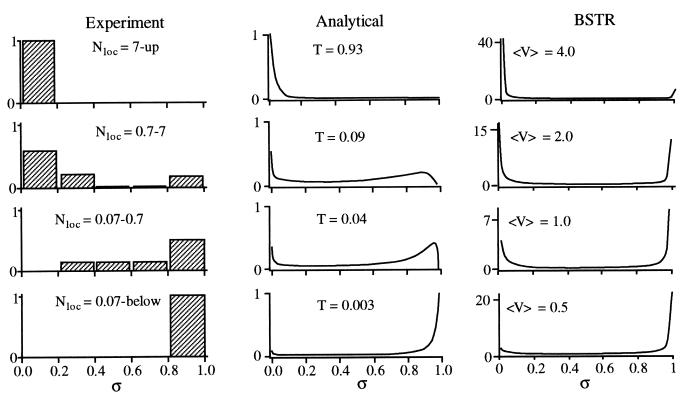
Figure 2.
Distribution P(σ) of dilution factors for four different values of the locally coupled number of states. (Left) Experimental distribution obtained by binning the data in Fig. 1C into the Nloc ranges shown. (Center) Analytical P(t) (normalized to 1) from Eq. 8 for four values of T. (Right) Numerical BSTR P(t) (normalized so ∫dσP(σ) = 1) for different coupling strengths.

