
Figure 3.
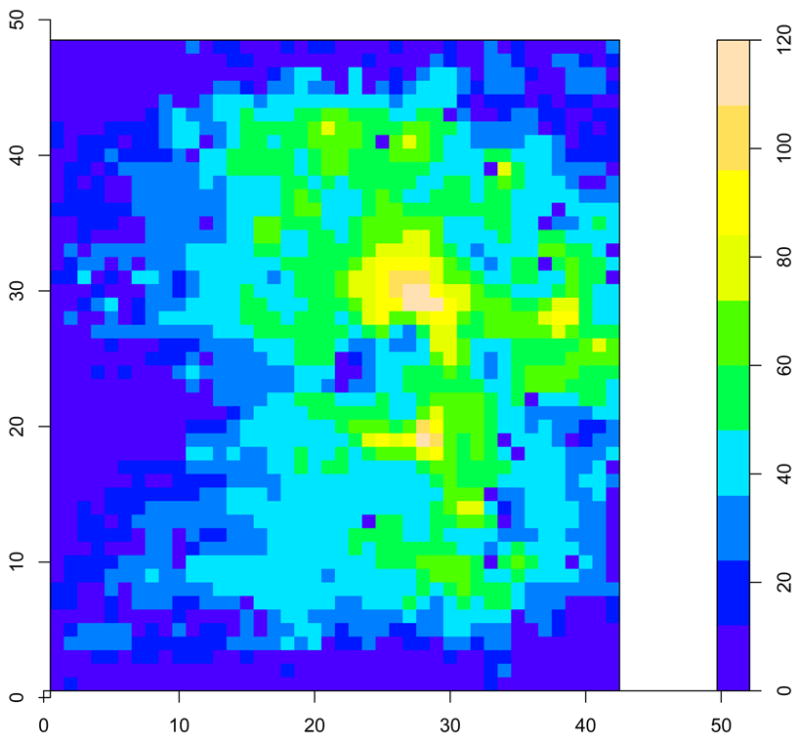
An example of pressure intensity data at the seating interface for one subject: each pressure intensity at the seating area corresponds to a color-scale rectangular segment in the image. The color bar indicates the mapping from intensity values to colors.