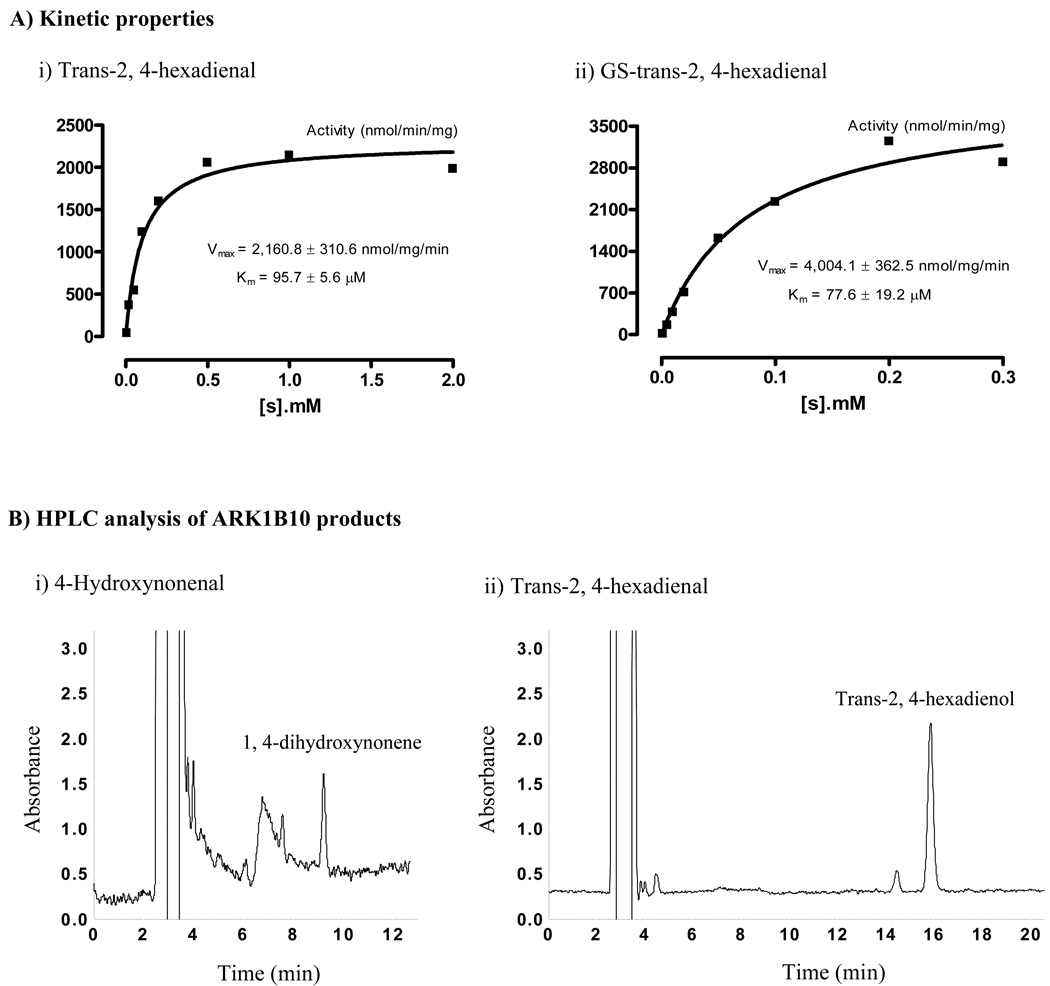
Fig. 1. Substrate-velocity curves and HPLC chromatographs of AKR1B10 products.
A) Substrate-velocity curves. AKR1B10 enzymatic activity to trans-2, 4-hexadienal and glutathione (GS)-trans-2, 4-hexadienal was measured as described in Materials and Methods. Substrate-velocity curves were produced with GraphPad Prism 4 (Graph Pad Software, CA). B) HPLC analysis of the AKR1B10 products. Enzymatic reactions and HPLC separations of mixtures (100 µl) were performed as described in the Materials and Methods. (i) HNE products. Image shows the product DHN when HNE was used at 0.2 µM. The small peak at 7½ min is β-mercaptoethanol present in the AKR1B10 protein preparation. Noise at 7 min constantly occurred at the detection wavelength of 190 nm. (ii) Trans-2, 4-hexadienal products. Image shows the product trans-2, 4-hexadienol when trans-2, 4-hexadienal was used at 0.2 µM. The small peak at 14½ min is noise at 228 nm. DHN and trans-2, 4-hexadienol standards were prepared by complete reduction with excessive aldose reductase proteins. HNE, 4-hydroxynonenal; DHN, 1, 4-dihydroxynonene; and HPLC, high-performance liquid chromatography.

