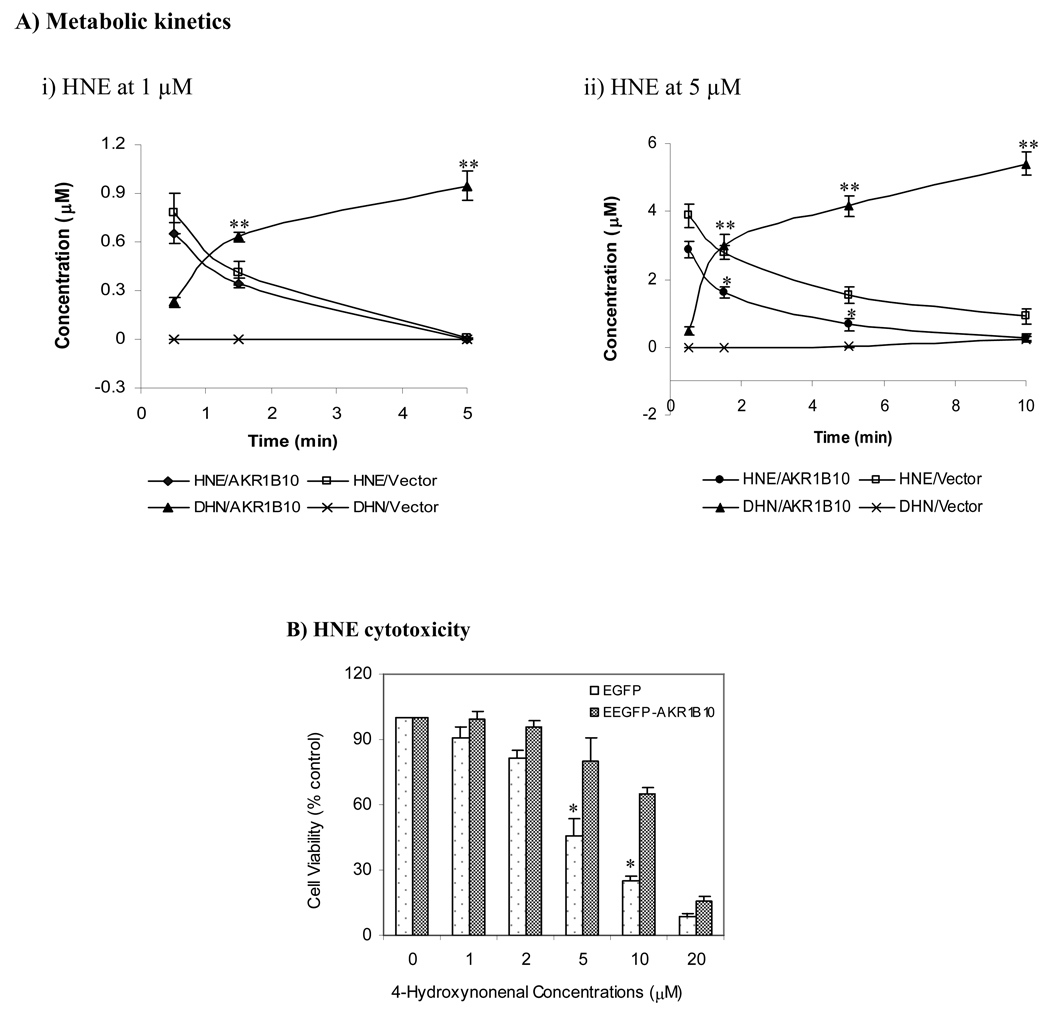
Fig. 3. HNE metabolism and cytotoxicity in 293T cells.
AKR1B10 delivery into 293T cells and HNE treatment were performed as described in the Materials and Methods. A) Metabolic kinetics. Cells applied with 1 or 5 µM of HNE were collected at indicated time points. HNE and DHN were extracted and quantitated by HPLC as described in the Materials and Methods. Data represent mean ± SD from three independent experiments. *, p < 0.05 and **, p < 0.01, compared to the vector control. B) HNE cytotoxicity, detected by MTT cell proliferation kit as described in the Materials and Methods. Values indicate mean ± SD from three independent experiments. * p < 0.05, compared to EGFP-AKR1B10 cells. HNE, 4-hydroxynonenal; DHN, 1, 4-dihydroxynonene; and EGFP-AKR1B10, enhanced green fluorescent protein/aldo-keto reductase family member B10 fusion protein.

