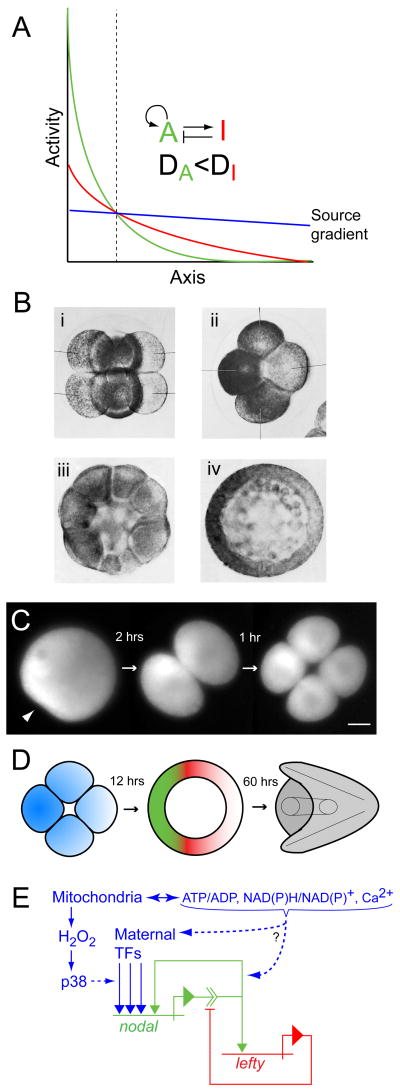
Figure 2.
Secondary axis specification in the sea urchin embryo. (A) Model of axis specification via a Gierer-Meinhardt type ‘reaction-diffusion’ system involving a short-range activator “A” that activates itself and its longer-range inhibitor “I” (redrawn from Gierer and Meinhardt, 1972: Figure 1c; [89]). “DA” and “DI” denote the respective rates of spatial redistribution (by diffusion or other means) of the activator and inhibitor. The final pattern of activator (green) and inhibitor (red) develops from an initially shallow source gradient of activator (blue). The vertical dashed line demarcates the boundary between final territories wherein the activator is ‘on’ and ‘off’. (B) Early sea urchin embryos labeled with indophenol blue, a specific indicator of cytochrome oxidase, showing asymmetry in mitochondrial distribution: (i) 8 cell embryo, lateral view; (ii) 8 cell embryo, polar view; (iii) 32 cell embryo, lateral view; (iv) mesenchyme blastula, polar view (from Czihak, 1963 [91]; reproduced with permission from Springer). (C) Time-lapse series of wide-field fluorescence micrographs showing the first two cleavages of a sea urchin zygote stained with MitoTracker Green FM. The arrowhead in the first panel points to the sperm entry point. An asymmetric distribution of mitochondria present in the egg produces a gradient of mitochondrial densities among the blastomeres, the high end of which specifies the oral pole of the embryo (from Coffman et al., 2004; [95]). (D) Schematic of oral-aboral axis specification in the sea urchin embryo showing relationships between mitochondrial gradient in the early embryo (blue), domains of dominance of Nodal (green) and Lefty (red) in blastula stage embryos, and the morphology of the pluteus larva (grey). The color scheme corresponds to that in (A). (E) Regulatory relationships of nodal and lefty that fulfill the activation and inhibition criteria shown in (A) (using the same color scheme), as discussed in the text. Mitochondrial inputs that contribute (or have the potential to contribute) to establishing the initial source gradient of nodal expression are shown in blue (modified from Coffman et al. [98]).

