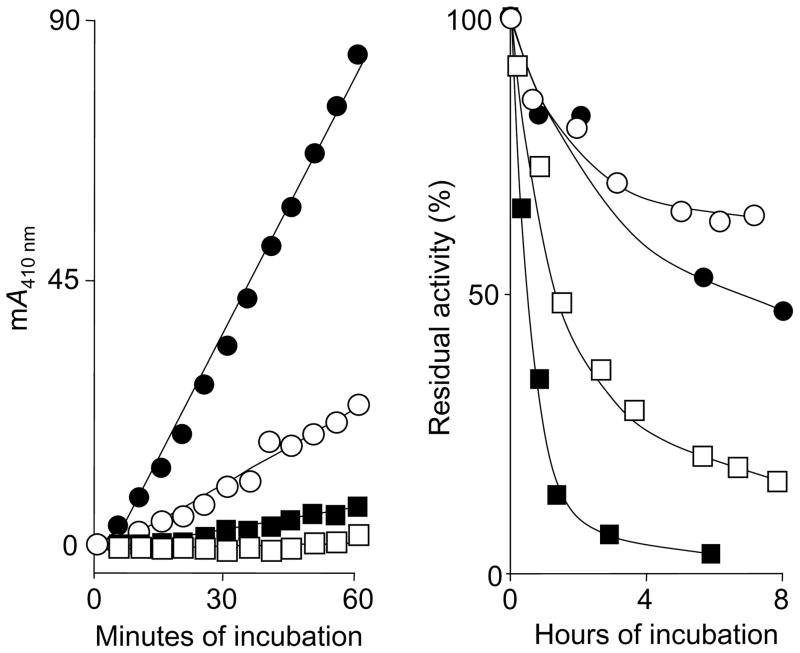
FIGURE 3.
Stability of chymase and cathepsin G activity in serum. The left panel shows examples of repeated measurements of A410 nm in single wells of a 96-well plate in a kinetic spectrophotometer at 37°C. Individual wells contained RETF-4NA substrate (0.5 mM) and spiked chymase concentrations as follows: ●, 2.1 ng/ml; ○, 0.68 ng/ml; ■, 0.23 ng/ml, and □, 0.08 ng/ml. The right panel shows results of long-term incubations of human cathepsin G and chymase in serum (○, cathepsin G; ●, chymase) and PBS (□, cathepsin G; ■, chymase). Enzyme spiked serum and PBS were incubated as stocks for 8 h. Aliquots were withdrawn at the indicated intervals and subjected to cuvette-based spectrophotometric assay of chymotryptic activity using AAPF-4NA for chymase and VPF-4NA for cathepsin G. Results are expressed as percentage of activity relative to activity measured at the start of incubation.

