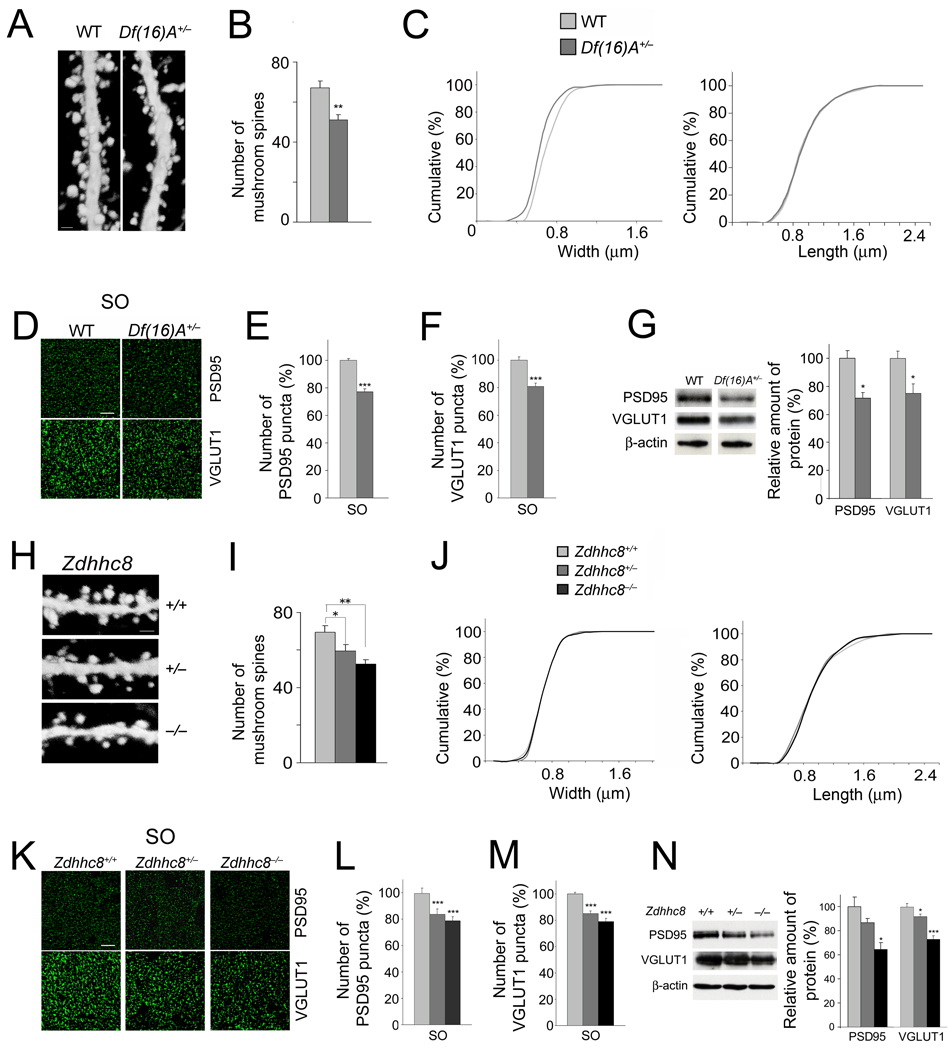
Figure 5. Alterations in spines/excitatory synapses in the HPC of mutant mice.
(a) High magnification representative images of EGFP-expressing neurons in the CA1 region of the HPC of Thy1-GFP+/− (left) and Df(16)A+/−;Thy1-GFP+/− (right) mice. Dendritic spines located at basal dendrites are shown. Scale bar, 1 µm.
(b) The density of mushroom spines (estimated over 75 µm of dendritic length) is reduced in Df(16)A+/−;Thy1-GFP+/− neurons.
(c) Reduction in the width (left: P < 0.05, K-S test), but not length (right: P > 0.05, K-S test), of mushroom spines of Df(16)A+/−;Thy1-GFP+/− CA1 hippocampal neurons relative to WT Thy1-GFP+/− CA1 neurons.
(d) Representative images of the immunohistochemical analysis for PSD95 (top) and VGLUT1 (bottom) puncta performed on hippocampal slices from adult Df(16)A+/− mice and WT littermates. Scale bar, 10 µm.
(e,f) Quantification of PSD95 (e) and VGLUT1 (f) puncta number in the SO layer sampled along the dorsal/ventral axis of the HPC in the Df(16)A+/− mice.
(g) Total protein levels of PSD95 and VGLUT1 in HPC lysates from adult Df(16)A+/− mice and WT littermates. Representative western blot images are shown on the left.
(h) Representative images of CA1 EGFP-expressing neurons from the HPC of Zdhhc8+/+;Thy1-GFP+/− (top), Zdhhc8+/−;Thy1-GFP+/− (center) and Zdhhc8−/−;Thy1-GFP+/− (bottom) mice. Spines located on basal dendrites are shown. Scale bar, 1 µm.
(i) The density of mushroom spines (estimated over 75 µm of dendritic length) is reduced in Zdhhc8+/−;Thy1-GFP+/− and Zdhhc8−/−;Thy1-GFP+/− neurons.
(j) No differences are observed in the width (left: P > 0.05, K-S test) or length (right: P > 0.05, K-S test) of mushroom spines in Zdhhc8+/− or Zdhhc8−/− neurons.
(k) Representative images of the immunohistochemical analysis for PSD95 (top) and VGLUT1 (bottom) puncta performed on hippocampal slices from adult Zdhhc8+/− and Zdhhc8−/− mice and WT littermates. Scale bar, 10 µm.
(l,m) PSD95 (l) and VGLUT1 (m) puncta numbers in the SO layer, sampled along the dorsal/ventral axis of the HPC of adult Zdhhc8+/− or Zdhhc8−/− mice and WT littermates.
(n) Western blot analysis of total protein levels of PSD95 and VGLUT-1 in HPC lysates from adult Zdhhc8+/− and Zdhhc8−/− mice and WT littermates. Representative images are shown on the left. Data are shown as mean ± S.E.M. * P < 0.05, ** P < 0.001, *** P < 0.0001.

