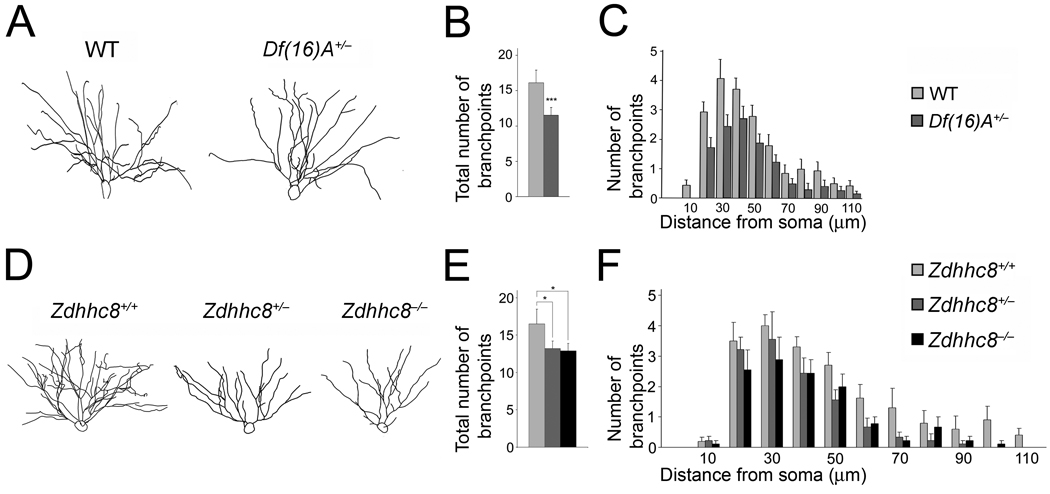
Figure 6. Alterations in dendritic complexity in the HPC of mutant mice.
(a) Representative tracings of the basal dendritic tree of pyramidal neurons from the CA1 region of the HPC of Df(16)A+/−;Thy1-GFP+/− and WT Thy1-GFP+/− mice.
(b) Reduction in the total number of branchpoints of basal dendrites in Df(16)A+/−;Thy1-GFP+/− CA1 hippocampal neurons relative to WT Thy1-GFP+/− CA1 neurons.
(c) Sholl analysis of dendritic complexity using 10 µm concentric circles around the soma. A repeated measures ANOVA examining the interaction between branchpoints and distance from the soma shows an overall genotype effect indicating a significant reduction in branching prevalent throughout the dendritic tree (n = 18, P < 0.008).
(d) Representative tracings of the basal dendritic tree of pyramidal neurons from the CA1 region of the HPC of Zdhhc8+/+;Thy1-GFP+/–, Zdhhc8+/–;Thy1-GFP+/− and Zdhhc8−/− ;Thy1-GFP+/− mice.
(e) Reduction in the total number of branchpoints of basal dendrites in Zdhhc8+/−;Thy1-GFP+/− and Zdhhc8−/−;Thy1-GFP+/− CA1 hippocampal neurons.
(f) Sholl analysis of dendritic complexity. Analysis of the interaction between branchpoints and distance from the soma shows an overall genotype effect (n = 36, P < 0.01). Data are shown as mean ± S.E.M. * P < 0.05, ** P < 0.001, *** P < 0.0001.

