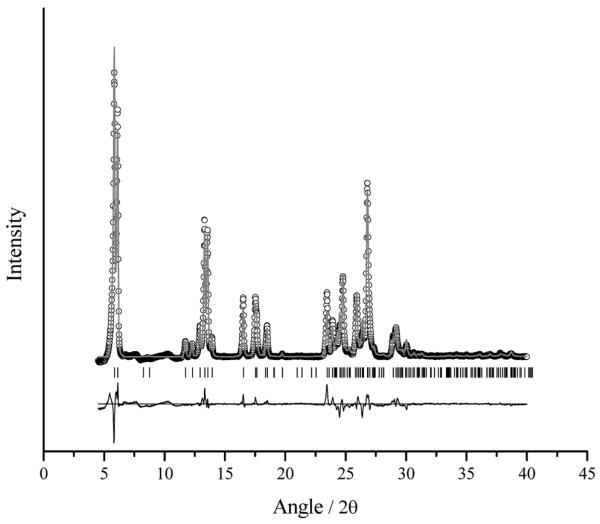
Fig. 1.
X-Ray powder diffraction pattern of LiNc. The points represent the experimental data points, while the calculated pattern from the simulated annealing is shown by the solid line. The tick marks indicate the allowed peak positions for this specific structure, while the difference curve is shown underneath the patterns.

