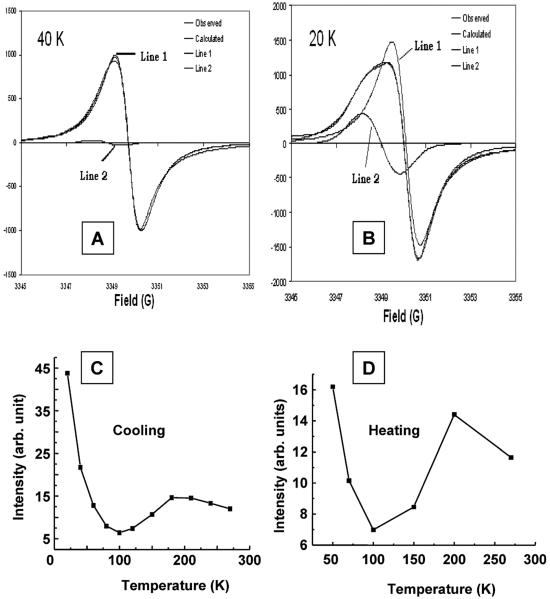
Fig. 7.
Simulation of the EPR spectra and temperature dependence of EPR intensity. The simulations of spectra measured at (A) 40 K and (B) 20 K show their decomposition into two isotropic lines. Though the intensities of both lines increase on decrease of temperature, the relative intensity of the low-field high-g line is higher on lowering the temperature. (C) and (D) show temperature dependence of integrated EPR intensity of LiNc crystals under vacuum on cooling and heating.

